The Two Charts That Have Twitter Investors Fleeing
Twitter's 2013 financials may have delivered better-than-expected results but that hasn't stopped the social network's share price from taking a beating in after-hours trading, and that looks to be down to engagement. Although revenue was solid, a stall in new users has some investors spooked, and Twitter's own charts show the root of its problems: getting new sign-ups to log on, and old users to come back.
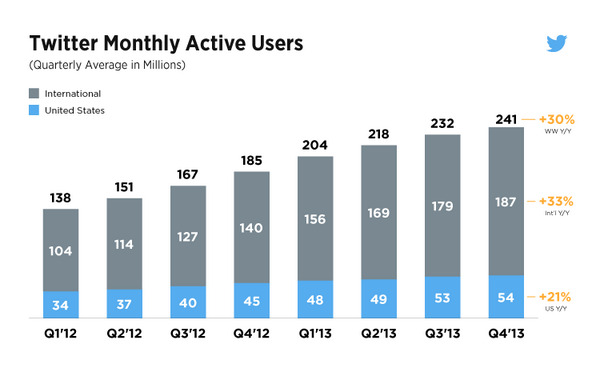
In a pair of graphics prepared by the company, the numbers of active monthly users and the amount of timeline views are set out against their historic figures, and it's hard to argue against a slide. Although total users has grown overall, up to 241m versus 232m in Q3 2013, the bulk of that change has been internationally – which US investors are less keen on, for reasons of advertising among others – whereas the US increase has grown sluggishly all through 2013.

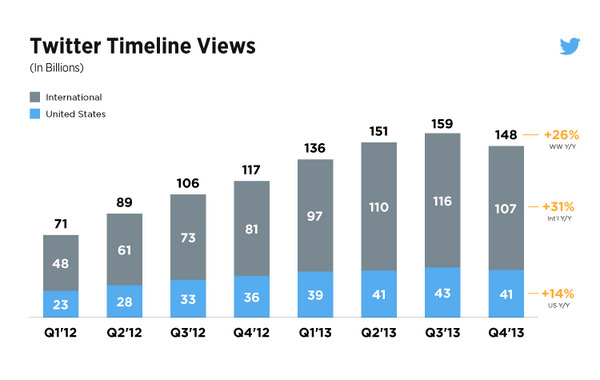
The number of timeline views is even more disappointing, viewed from a US-centric perspective. In fact, Q4 2013 saw a drop in views – down to 41bn from 43bn in the previous quarter – in the US, and an even bigger drop internationally, down from 116bn to 107bn.

Twitter is highlighting the fact that, year-on-year, the numbers have all risen, but social is a fickle beast and investors are reacting to more recent changes. It's a similar challenge to the one Facebook is facing, as the easy-pickings are taken and it gets harder to find new sign-ups; that's forcing Zuckerberg & Co. to look to task-specific apps like its new Paper newsreader.
At time of publication, Twitters share price (TWTR) was down around 11-percent in after-hours trading.
