How To Use A Wi-Fi Heatmap To Improve Your Connection

One of the most common problems in home and commercial settings can be troubleshooting the Wi-Fi connection. It can be slow at times and totally non-existent in certain corners, which is extremely frustrating since you can't watch your favorite YouTube video or send your boss an email. According to Performance Networks, spotty Wi-Fi connections are due to various reasons, from physical obstructions to interference from other wireless networks. While it's easy to identify some of the reasons why your Wi-Fi is slow, you can't really know the big picture just by inspecting the area with your naked eye.
This is where Wi-Fi heatmaps come in handy. Providing you with a visual representation of how healthy the signal is in a certain space, Wi-Fi heatmaps help you gain an in-depth understanding of your network. This way, you can eliminate the guesswork to try and solve your Wi-Fi coverage problems with ease, and improve your connection in the process.
What is a Wi-Fi heatmap?
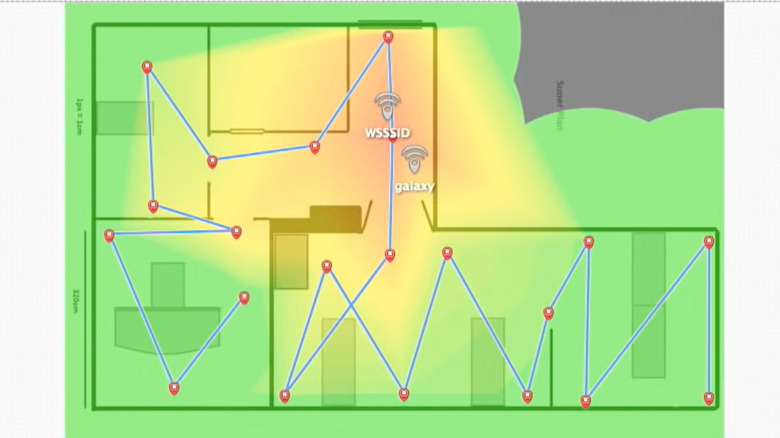
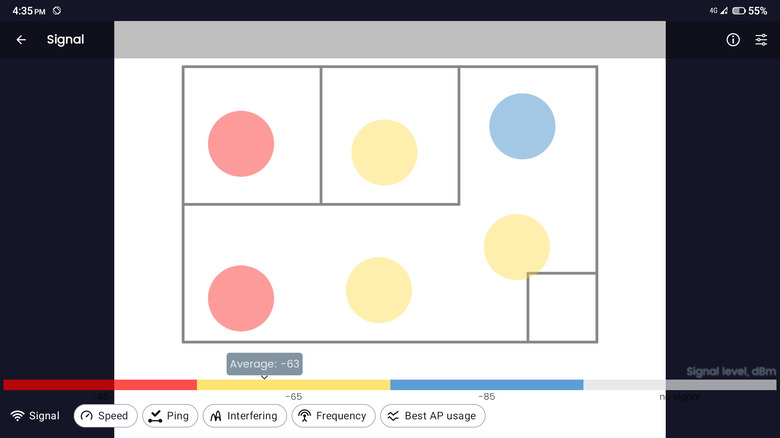
According to NetSpot, a Wi-Fi heatmap is a color-coded map of a space (e.g., house, office, classroom) that shows how strong the wireless connection is in certain areas. It typically follows the traffic-light color coding, where green has the strongest signal, yellow has a somewhat strong signal, and red has the weakest signal.
What makes heatmaps a great tool for improving your Wi-Fi connection is that they can help you plan your network coverage appropriately. When you know which areas receive the weakest signal, you can add new access points or relocate your router to eliminate the Wi-Fi dead zones and optimize your network. The heatmaps will also give you a better understanding of how your wireless signal is distributed across your space, as well as what object signal interference like walls and large furniture you need to account for.
Wi-Fi heatmaps are different from speed tests in that the latter will only show you the maximum speed of the device you're using at that particular point in your space. On the other hand, heatmaps display the bigger picture of your signal strength. For instance, it can tell you that half of your kitchen has a good (green) signal, while the other half has a weaker (yellow) signal. If you're using a speed test only, you won't know exactly where the signal strength drops.
What tools to use for Wi-Fi heatmapping
Making a Wi-Fi heatmap may sound too complex and technical, but it's actually a pretty straightforward process that you can do yourself. All you would need is a Wi-Fi heatmapping software or app and your device of choice (Android, iOS, macOS, Windows, or Linux). A mobile device would be better suited for this task, as it requires you to move around the space. It also helps if you have a floor plan of the space you want to map out, but it's not entirely necessary since most apps let you draw it instead. However, you would need to measure the areas as accurately as you can to produce better results.
A few of the heatmap applications you can use include NetSpot, Ekahau, VisiWave, Solarwinds, wifisigmap, and WiFi Heatmap by Wi-Fi Solutions. Most of these are paid apps and are used by professionals. If you're only mapping your home, the heat-mapper apps on Google Play Store and Apple App Store can do the trick just fine.
How to make a Wi-Fi heatmap using Android
In this guide, we will use the Wi-Fi Heatmap app on Android to make a heatmap of the space. Here's how to do so (via Google Play Store):
- Grab your Android device and install the app from the Google Play Store.
- Launch the app.
- Scroll down to the bottom of the homepage.
- Tap on "Create Heatmap."
- Select the button for "Create Heatmap" again.
- From the menu, select "Draw your floor plan." You can also choose "Indoor" if you have a floor plan ready to upload.
- Start sketching the area you want to map out. Then, hit "Save."
- On the pop-up box, select "Create Heatmap."
- Move the two red circular markers to two points on your map.
- Select the real-life distance between them to calibrate your map.
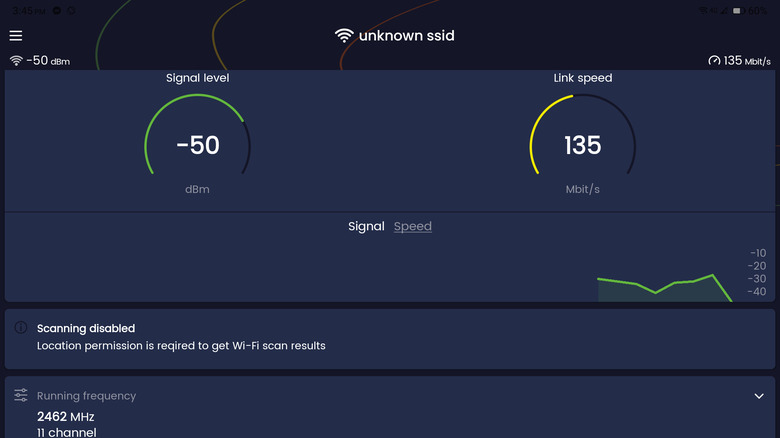
- Drag the blue cursor to where you're currently at. You will see the signal strength in that spot (measured in dBm) at the bottom of the screen.
- Tap the Mark button on the center of the screen to mark that area.
- Move to another area on your map and repeat the same process.
- After covering the entire map, tap the "Save" button on the far right of the screen.
You can now use this map to better plan your home network, shift some things around, and otherwise work on improving the coverage in the furthest reaches of your home.