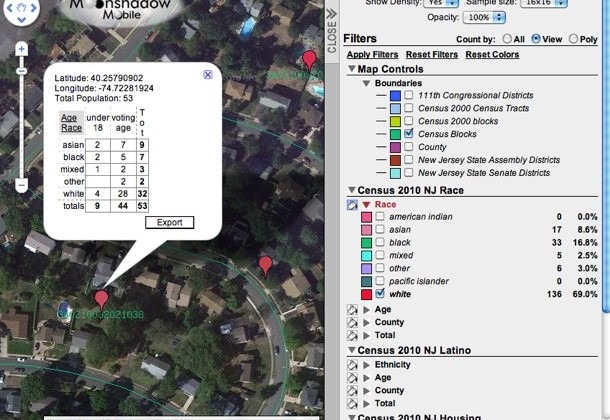
Your Neighborhood's Census Data Gets Mapped
Ever wondered about the demographics of your neighborhood? For those with school-aged kids, or those seeking to buy a new house, having access to demographics and other public data pertaining to certain neighborhoods can be very helpful. Companies, such as MoonShadow Mobile, have now mapped these types of data for easy access and visualization and to make the information more understandable.
MoonShadow Mobile specializes in working with large data sets with their map allowing users to look at race, gender, age, and other information pulled from eight different data sets. They have made a block-by-block, state-wide data visualization of New Jersey so far with more states to come. The New York Times has also mapped out demographic data but only measuring race covering the entire US.
And now with the results of the 2010 US Census getting published along with Google's release of their Public Data Explorer last week, everyone can create their own data visualizations. It'll be interesting to see what visually dazzling and useful data maps and graphs creative folks will come up with soon.
[via ReadWriteWeb]
