NASA's Amazon Forest Fire Map Shows Just How Much Trouble We're In
NASA has published a new sequence showing the carbon monoxide plume generated by the wildfires in Brazil, tracking the changes each day starting from August 8. The country has experienced record wildfires this year, and, as of August 23, has more than 2,500 active fires throughout the Amazon. NASA's time-series map shows the carbon monoxide concentrations at an altitude of 18,000ft.
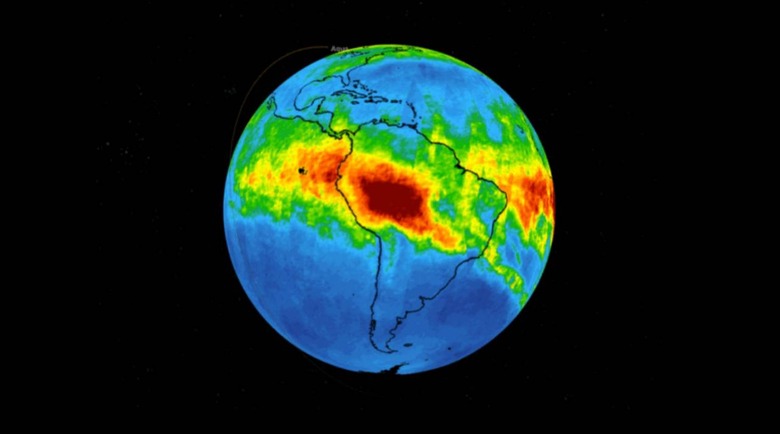
The data was gathered by the space agency's Atmospheric Infrared Sounder (AIRS) instrument, which is located on the Aqua satellite. Each 'day' in the animation represents three actual days ranging from August 8 to August 22. NASA explains the green parts of the map represent carbon monoxide levels around 100 parts per billion by volume.
The yellow areas represent a greater concentration of around 120 parts per billion, and the dark red area shows concentrations around 160 parts per billion. The increasing concentration is seen moving toward the southeastern part of Brazil as the days progress. A high-resolution version of NASA's gif can be found here.
According to NASA, carbon monoxide is able to hang out in the atmosphere for around one month. Assuming the gas stayed trapped that high up in the atmosphere, it wouldn't have much of an impact on the air humans breathe. However, if a downward draft pulls the carbon monoxide lower, NASA warns it may 'significantly impact' the breathable air quality.
The carbon monoxide is released by the trees as it burns, having a major impact on climate change in addition to polluting the air. According to the Amazon Environmental Research Institute, the spike in wildfires is the result of deforestation. NASA has been tracking the fires with its Earth satellites, keeping the public updated.