ESA's New Online Map Tool Shows Pollution Levels Around The World
The European Space Agency (ESA) has released a new online mapping tool that shows the level of nitrogen dioxide pollution around the world. The data comes from the Copernicus Sentinel-5P (S5P) satellite, which was launched in 2017 to measure air pollutants globally using its Tropomi instrument. This online portal is released as part of the wider S5P Product Algorithm (S5P-PAL) project.
Nitrogen dioxide is a pollutant that results from vehicles, various industrial facilities, and power plants. When in the atmosphere, this pollutant puts human respiratory health at risk, making it a public health concern. Now anyone can view the levels of this pollutant where they live using the ESA's related mapping tool located on its website here.
This is the first of multiple mapping products that will be released to publicly showcase data from the Sentinel-5P satellite, according to the space agency. Teams are currently working on developing a map that shows the global levels of carbon monoxide, for example; there are also other functions planned for the map like being able to select a specific region.
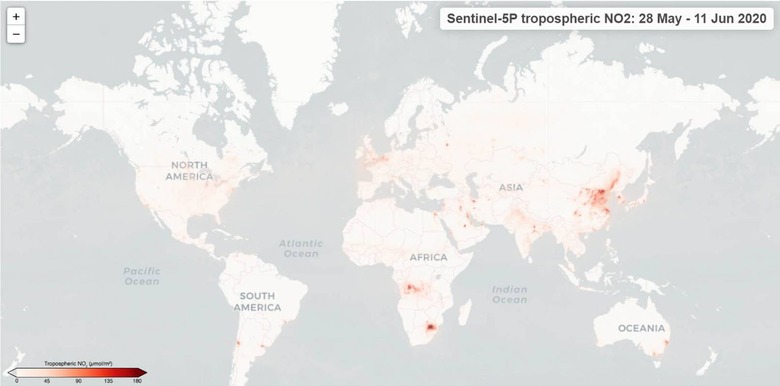
In the case of this current map, the ESA says that users are shown the average nitrogen dioxide pollutant concentrations for the region from the past 14 days. This reveals how the pollutant levels change over time with concentration levels for entire countries, broad regions, and narrowed locations like counties and cities.
Of note, the space agency points out that the changes in pollutant levels as a result of COVID-19 lockdowns are apparent in this map, highlighting the 'drastic reductions' experienced in cities around the world. The public will be able to compare this with future data as cities reopen and traffic increases.