Uber Pulled Post Correlating Crime Data With Ride Demand
Uber, steeped in criticism after various issues this month, has again found itself in the limelight, this time over a post from 2011 it has pulled from its blog. The post, which is still visible as a cached page, takes a look at how crime data — and prostitution in particular — correlates to Uber demand. The post is rather in-depth and looks at the "Uber science mutants" thought process, but has drawn some criticism due to, among other things, commentary about how observed prostitution spikes could be due to welfare checks becoming available.
The pulled post was discovered by Associate Professor of Communication Gina Neff from the University of Washington, who tweeted the cached page. The post is titled "Location knowledge is a proxy for Uber demand," and it was originally posted under the URL https://blog.uber.com/2011/09/13/uberdata-how-prostitution-and-alcohol-make-uber-better/.
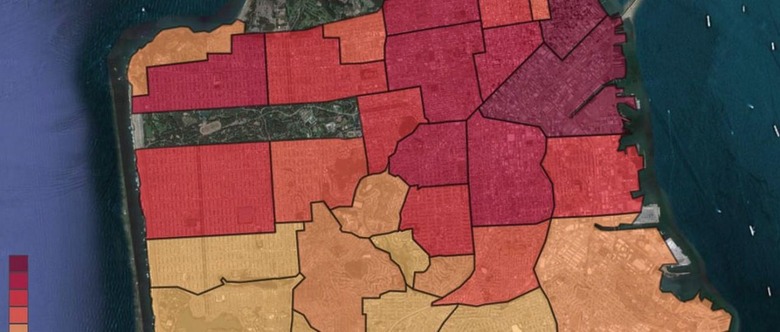
In the post, the data scientists show how Uber's demand pattern correlates to crime data in San Francisco, something that could aid the service in determining the location and times of high demand. On this point, the post read:
We needed a simple surrogate metric for where people are. We could do that by counting the number of businesses or bars or whatever in a neighborhood... but we had a better idea: look at crime.
The post when on to break crime data down into a dozen categories, then further broke that down to look into whether any specific crime categories were better able to predict ride demand. Through a process of narrowing it down, the researchers found that "4 crimes remained significantly correlated", and those were prostitution, alcohol, theft, and burglary. Following this, the post declared:
Areas of San Francisco with the most prostitution, alcohol, theft, and burglary also have the most Uber rides. Be safe, Uberites!
This was assumed to likely be due to population density in the regions, with the higher crime rates reflecting the higher population. The scientists then moved toward looking into the "ups and downs" of crime, finding that it peaked between 6pm and 8pm, and that in particular there was a big peak in prostitution on Wednesday nights.
This is where the post starts to run off course, with it saying, "Now mind you, at this point we're straying from the Uber ride-prediction path." That doesn't stop the researchers from continuing to comment on the data, however, leading into speculation about why prostitution might spike on Wednesday nights.
I even stopped to talk to 2 Berkeley cops to see if they knew why prostitution peaked at this time (seriously). They had no idea. But then someone pointed out to me that Social Security and welfare checks arrive on the second, third, and fourth Wednesdays of each month. Oh man. Now we're into dangerous, politically-charged territory.
The commentary leads from there into talk about how prostitution is highest on the second Wednesday of every month, and that:
One possibility is that on the second Wednesday, people get their checks after two weeks without any income. The first Wednesday: no checks. Second Wednesday: cash in hand! It might be that any time there's an influx of cash into a city, there's also a bump in prostitution crimes. That's harder to check, but worth following up. We don't see this effect for any other types of crimes. Just prostitution.
It isn't clear at this time when Uber pulled the blog post nor the reason for doing so.
SOURCE: Venture Beat