Google hires Twitter's data guy

Google just hired one of the most important people at Twitter to join their team as Trends Data Editor. Not that Simon Rogers is going to make or break a company like Twitter, but the ability to do what he did for Twitter – and what he'll be doing for Google – is really, really is an important role. Especially for the public, seeing how events explode in a virtual way, seeing that sort of thing clearly, and easily – that's what Rogers does.
Rogers works in analysis. More importantly, he works in the relay of data – once analyzed – transmitted from an event, into charts, to the public. Showing a bunch of numbers on how many users tweeted about what topic is great, but showing a chart like this is far, far better.
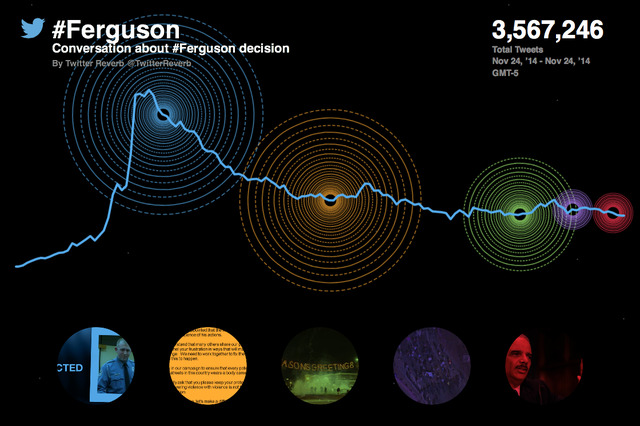
Rogers did several things at Twitter. One was to help create the tool called Reverb. Reverb is the tool that created the chart you see above.
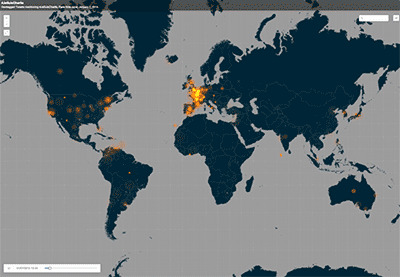
He also helped implement maps to show things like the world's reaction to the Charlie magazine incident. The "reaction to #JeSuisCharlie" is shown here:
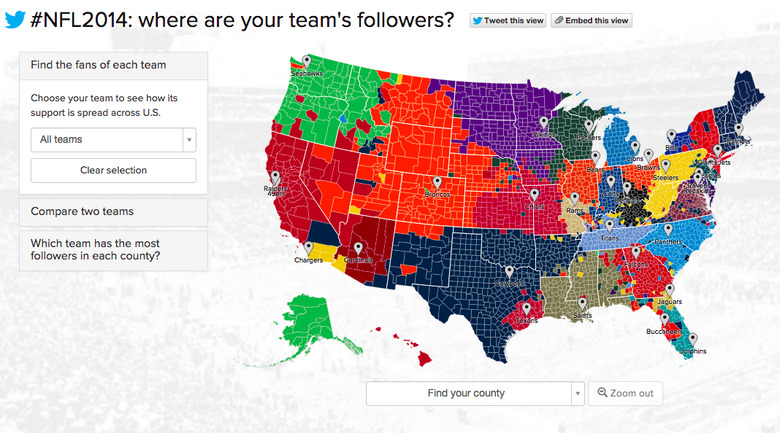
Interactive creations like the "#NFL2014: Where are your teams followers" chart are made by people like Rogers – this one was made by Krist Wongsuphasawat.
Essentially everything inside the @TwitterData account is what Rogers did – and what other data analysts do at Twitter today.
What will Rogers do at Google? Something similar, quite likely. We'll know more soon – a fellow like Rogers doesn't stay behind curtains for long.
VIA: Simon Rogers